METHODOLOGY

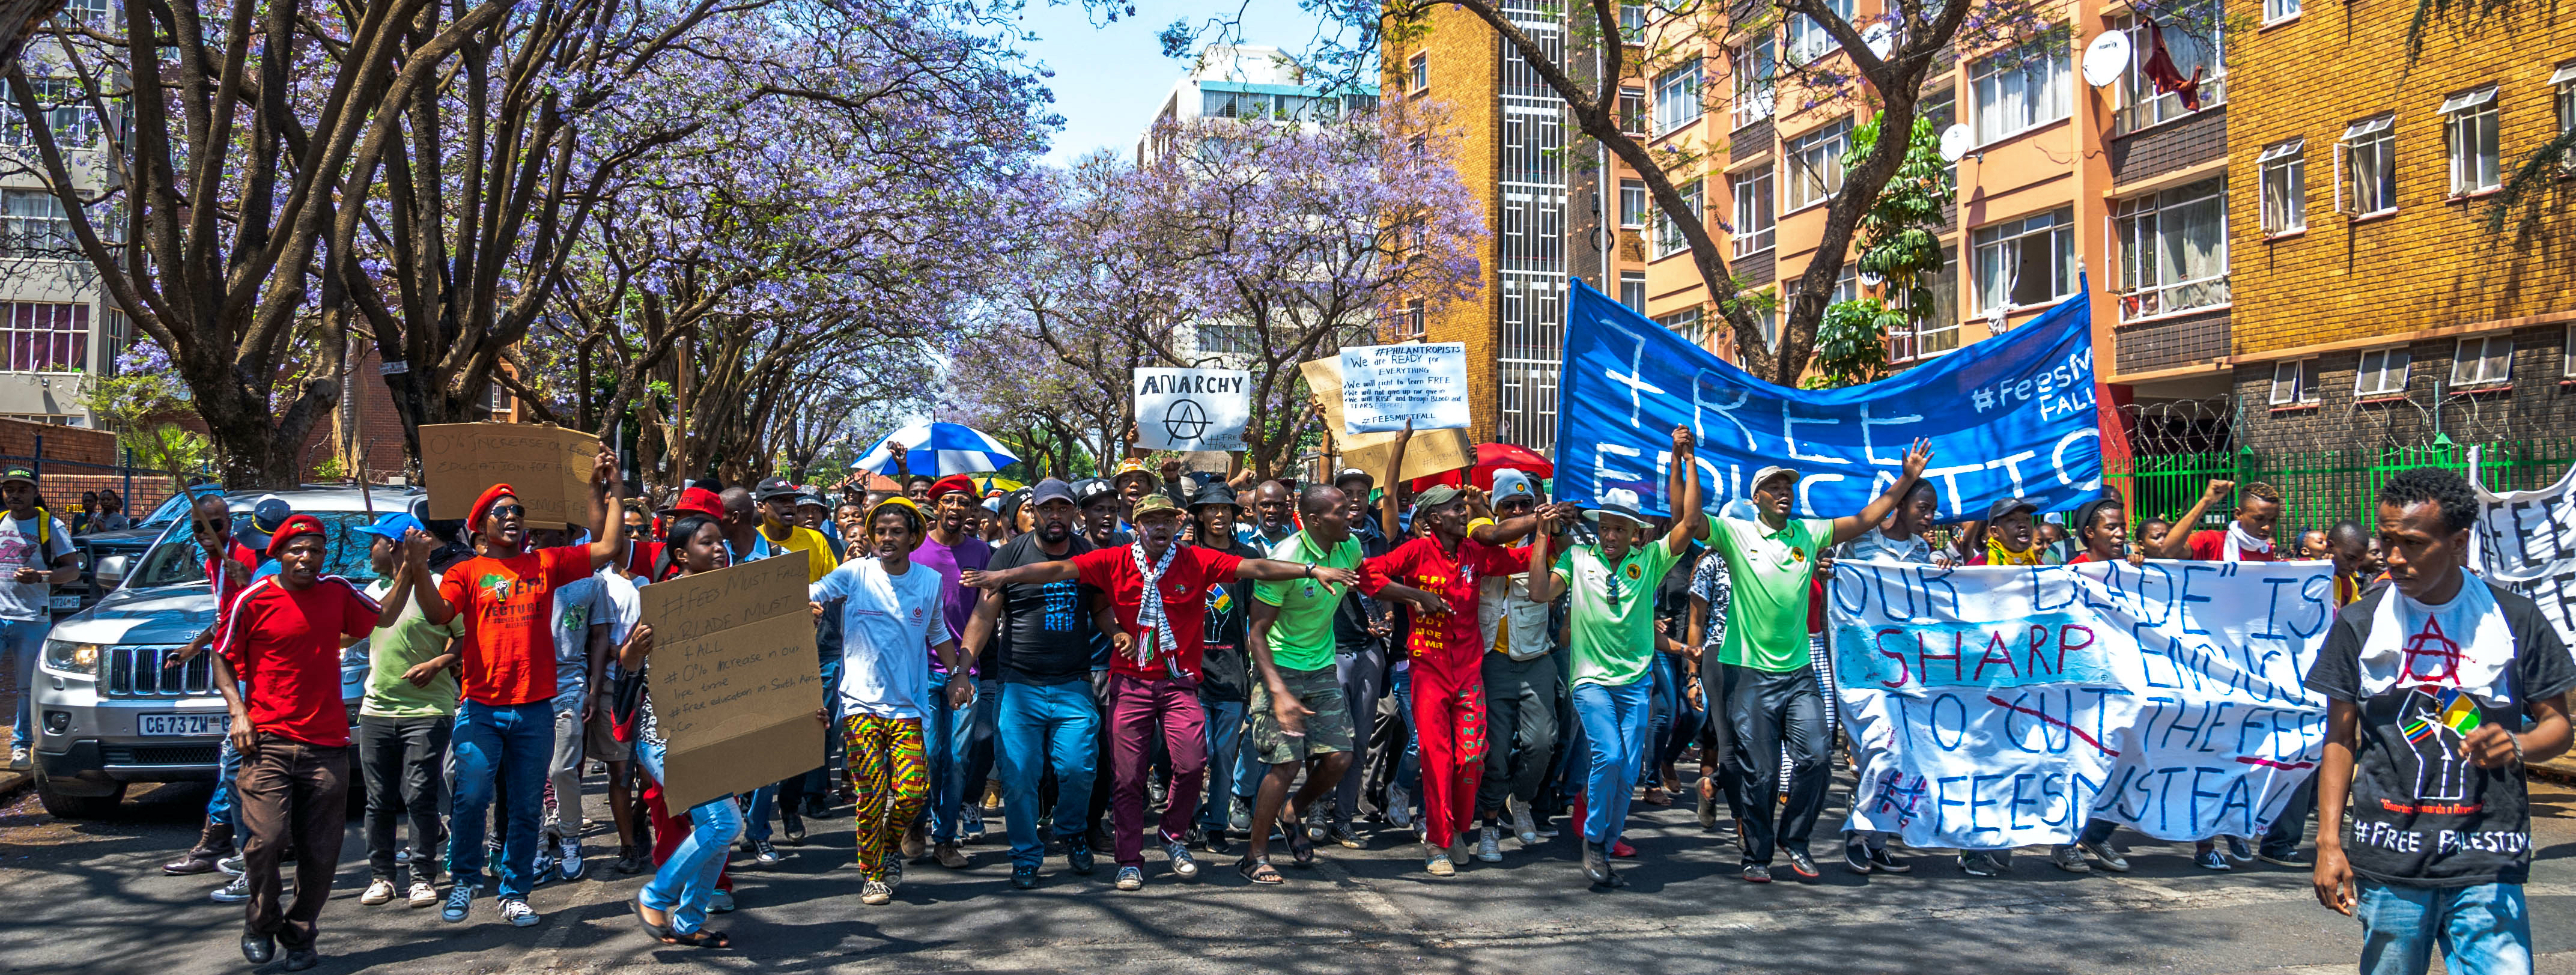
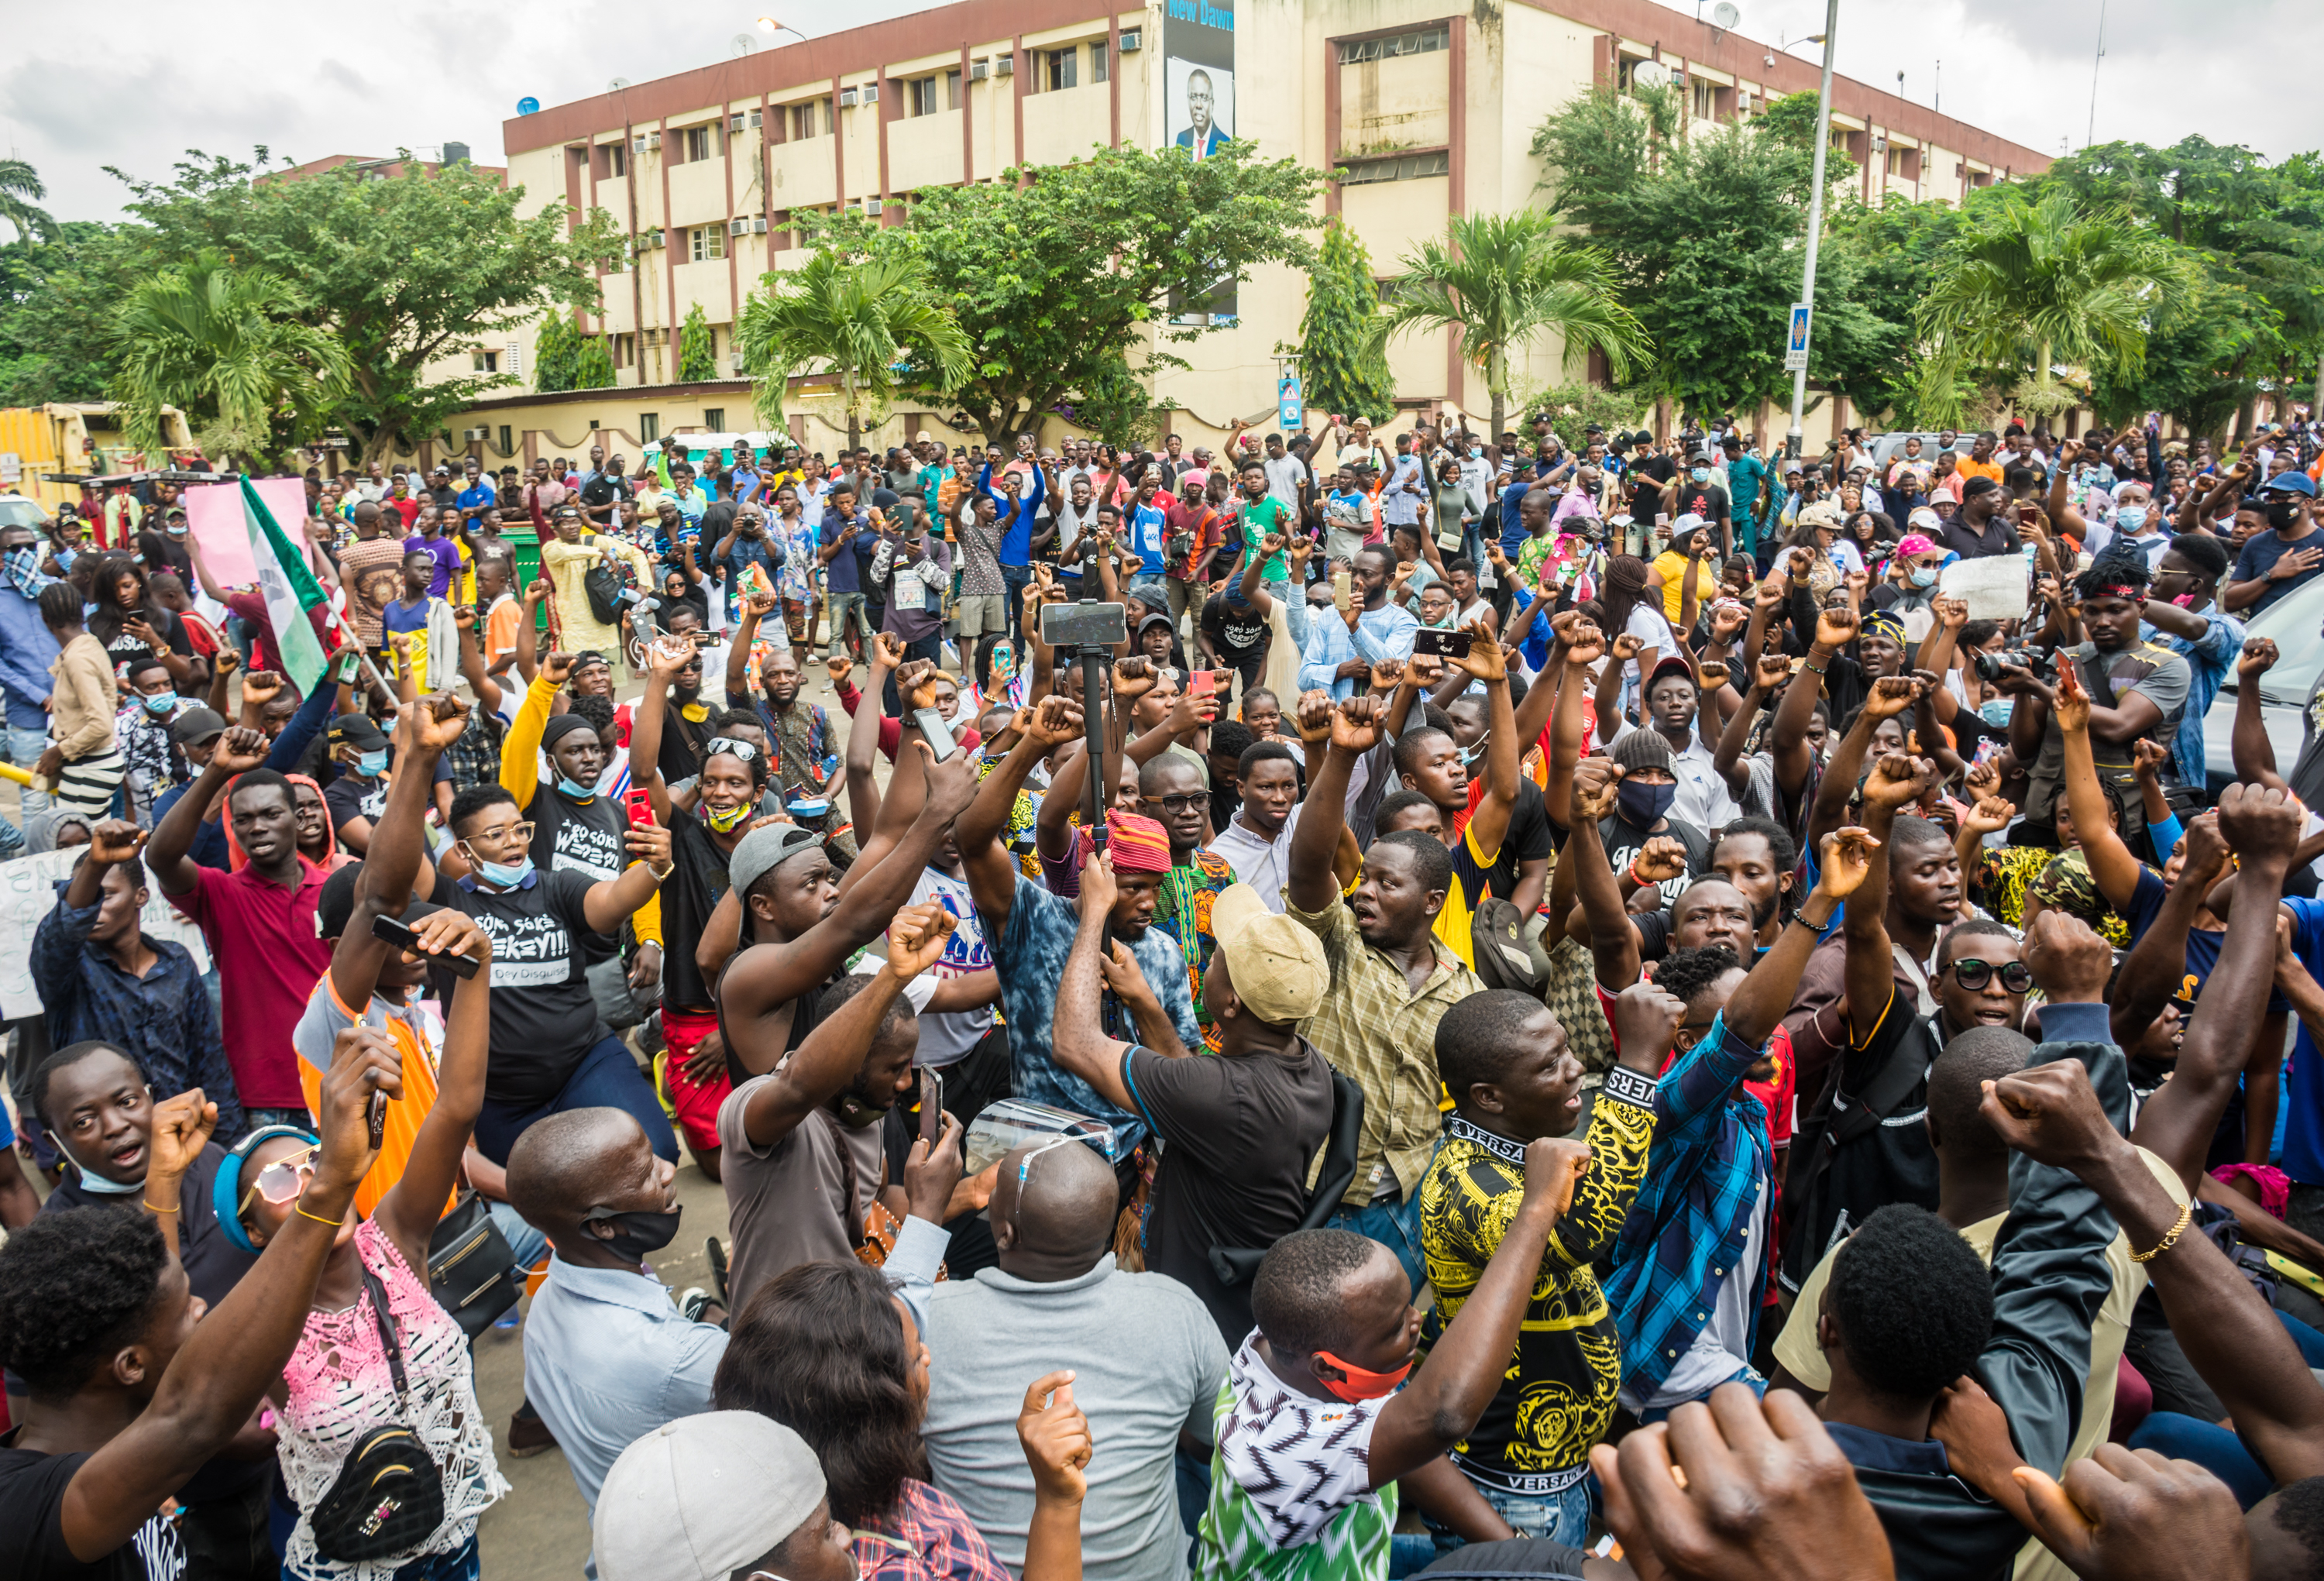
This research documents the significant role of educational institutions and school actors in contemporary political activism and struggles for social change in Africa. Specifically, this research asks: (1) What is the incidence of protest in educational institutions in Africa, (2) what are their explicit causes as defined by participants, and (3) What patterns exist within and across countries?
Since 2016, this study has worked to aggregate the first--and to our knowledge only--cross-national database of school-based protests in Africa since 2000. The year 2000 was selected as a starting point for this research because this is when an empirical gap on school protests in scholarly research begins, and also when a discernible resurgence in popular protests in Africa roughly begins. Previous pilot research produced data on school-based protests in two African countries, Nigeria and South Africa (Strong, 2018), and to date this research has collected data on school protests in all 54 African countries.
In addition to developing a comprehensive dataset in this area, this project utilizes an interactive mapping technology to visualize and make this data publicly accessible. This study aims to amplify and support the work of educational activists, and to provide researchers and practitioners with empirical data that will help them better understand the role of schools in contemporary political processes in Africa with the hope that further research will facilitate deeper analysis with reference to this under-studied region as well as the formulation of policies that support the potential of schools to positively affect social change.
The SPA site is intended for educational use only, therefore users should follow the guidelines for the usage and citation of the research site and data when using School Protest in Africa project, including (1) following the established citation format for this projects and its content, which includes the interactive maps, any research derived from the dataset, or any ideas derived from the School Protests in Africa Project; (2) the site may not be distributed for any commercial purpose; (3) misuse of the state and/or its data can result in termination of rights. Click here for further terms of usage for the project site and data.
PROJECT DESIGN AND METHODS
The School Protests in Africa dataset aggregates data on the incidence of school-based protests in African countries using archival research and web-based data aggregation tools developed in connection with the Google and Twitter application programming interfaces (APIs). In more lay terms, this means that we use web-based news and media sources to collect data on protest events since 2000. Because protests in this region are underreported in national and international news, this study also centers self-reported protest activities on social media platforms that are more accessible to youth.
To date, we have catalogued over 1,100 incidents of school protest across all 54 African countries since 2000, and recorded supplementary data on protest events including the groups of actors involved, the targets, causes of contention, and institutional and state responses.
An incident is considered a school protest event if it involves more than one actor and meets at least one of the following other criteria: (1) it is a social or political disturbance that takes place in a school or (2) it is a social or political disturbance that involves school actors (i.e., students, teachers or academic staff, non-academic staff, school administrators, or youth). We consider the following to be social or political disturbances that qualify as protest events: protests or demonstrations; riots or violence; strikes, boycotts, or industrial action; actions that result in school closure; vandalism or property destruction; roadblocks or other physical obstructions of activity; and online or media campaigns.

MATERIAL CULTURE AND SUSTAINABILITY OF THE WEB
Information regarding school protests in Africa is drawn from personal accounts, references on social media, and important corroborated by journalist accounts in the form of newspaper articles. As a means to further document school protests in Africa, glean contextual information on the occurrences and how they are articulated and understood in the broader public sphere, this project systematically seeks to compile newspaper and journalist accounts of protests happening on the continent. There is, however, a particular parcarity of these sources. On the one hand, state censorship introduces instability of the permanent record, particularly in instances where reporting is scrubbed from the internet. On the other, information loss can occur as a result of newspaper outlet closures or, even more innocuously, link degradation which occurs over time. As a strategy to mitigate information loss, our project has employed web-archiving strategies to stabilize the persistent URL associated with these newspaper and journalistic accounts of school-based struggle. Using Archive-it, the project team seeks to use web-archiving to preserve the record of the web pages related to school protests in Africa.
NOTE ON THE INTERACTIVE MAP
Our focus on creating preservable, sustainable, and archivable collections of data extends to the format of the project itself. While designing the dynamic components of the site, we tried to strike a balance between rich interactivity and long-term preservability. This is a particular challenge given the complexity of map visualizations, which combine heterogeneous forms of data from many sources: map tile sources, providing the textures and labels for the underlying map; visualization sources, providing the data itself, translated into visual forms; and interactivity sources, providing dynamic user interfaces that allow the data to be explored in relation to the map.
It’s a challenge to preserve any digital artifact with this level of complexity. Fortunately, there are visualization tools that can embed everything necessary to reproduce almost all the interactive components of the project inside a single, self-contained file -- including the code and the data itself -- allowing static web archiving utilities to capture them in their entirety. Using the Bokeh visualization platform, we wrote a Python script containing a set of embeddable JavaScript extensions. Although writing widgets in one language from within a script in another language is an awkward mode of software development, in this case it provides us with a practical compromise between preservability, transparency, and user experience.
The interactive protest map is designed to create an intuitive visual user experience for navigating a broad spatial dataset. The series of filters to the left of the map allow the user to think through what kinds of political actions they are interested in seeing, which actors, and additional characteristics. As they click through, the map updates in real time, allowing the user to begin to see geospatial patterns to the data that they are filtering. Hovering over any of the individual protest points provides more information about the protests in that location, and gives the user the option to click out for more detailed information and sources. This structure easily allows the user to hone in on particular details, while also affording the option to return to the bigger picture at any time.